Value Chart Editors
Value layers can be viewed and edited either as tables or charts. As a chart, the values can be displayed either as a bar chart or line chart. In the upper right corner is a 3-bar icon for popping up the value chart menu as shown below. In the lower right corner is a resize icon for changing the size of the chart.
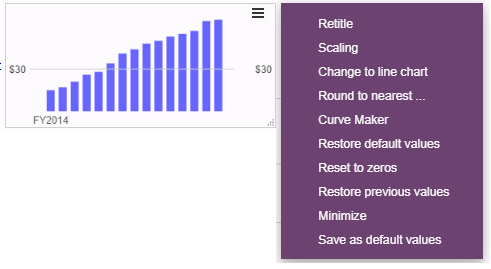
Each bar in the above chart represents the value for a particular period. Values can be changed by clicking or dragging the mouse on the chart. The value chart popup menu provides the following features.
- Retitle - provides a way to give a title to this value chart editor, which allows it to be added to a slide
- By year - shows a bar per year, rather than per period.
- By quarter - shows a bar per quarter (only if a monthly model).
- By period - shows a bar per period
- Scaling - choice of auto scaling or fixed scaling
- Auto Scale - choose a percentage which scales the largest value as some percentage of the chart value height.
- Fixed Scale - choose upper and lower limits, any value beyond these limits are only shown up to the upper (or lower) limit.
- Change to line chart - changes the display from a bar chart to a line chart
- Change to bar chart - changes the display from a line chart to a bar chart
- Round to nearest - choose rounding, typically set to 1 which will round new values, but leave existing ones as is
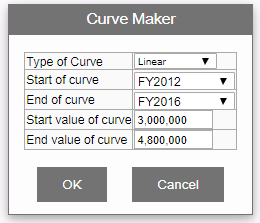
- Curve Maker - allows specifying a variety of curves specified by the following parameters
- Type of Curve:
- Linear (default)
- Growth Rate (specify growth rate)
- Exponential (specify end value, otherwise same as growth rate)
- Asymptotic
- S Curve
- Start of curve - specify start period at which curve is created
- End of curve - specify end period at which the curve ends
- Growth Rate - specify growth rate (per period or annual)
- Start value of curve - specify value for the start period
- End value of curve - specify value for the end period
- S Curve Inflection Point - specify period for the inflection point of an s curve
- S Curve Steepness - specify how steep the s curve should be (higher number is steeper)
- Type of Curve:
- Restore default values - restores previously saved default values
- Reset to zeros - clears data back to all zeros
- Restore previous values - undoes last change
- Save as default values - saves current values as default values (which can be restored in the future)