Chart View
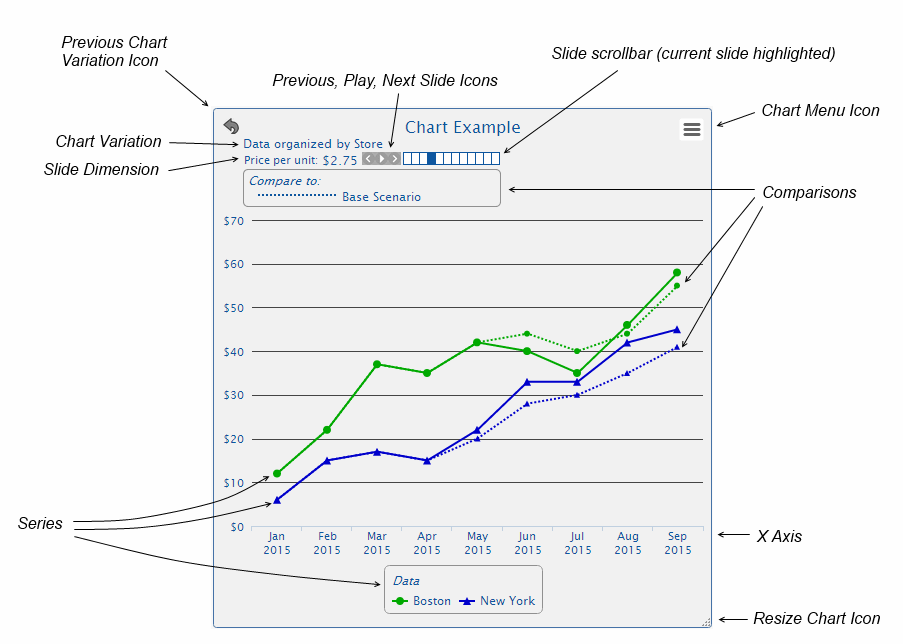
A chart displays data as any number of series, each series consisting of a sequence of points, one for each item in the X Axis. A chart may optionally have any number of slide dimensions, each slide dimension is a sequence of slides that varies some model parameter. Charts may also have comparisons and variants (for changing chart content such as the X Axis or Series).
Resizing a Chart
The chart can be resized by dragging the Resize Icon in the desired direction.
Chart Menu
The chart menu can be shown by clicking on the Chart Menu Icon. The chart menu includes the following options:
- Options: for changing the features or appearance of the chart (without changing the chart content).
- Variations: for changing the attribute of the data or chart (see variations below).
- Zoom Popup: displays a panel that with controls to increase or decrease the magnification level of the chart.
- Export the chart to a jpg, png, svg, or pdf file, or export the chart data as an HTML table.
- Help: displays this help topic.
Slides
Slides will vary across some dimension (time, data or other attribute). For each slide dimension of a chart (if any), a line showing the title of the slide dimension ("Price per Unit"), the current value ("$2.75"), 3 slide icons for displaying the previous slide, play all slides, and next slide, and finally a slide scrollbar with a box representing each slide in the slide dimension. Mousing over a box in the slide scrollbar will display the value. Clicking on a box will display the chart for that slide. Clicking a box with the control key held down will flip between the selected slides at a speed determined by the play speed in Chart Options. The play icon will display one slide at a time in sequence. Click on the slide dimension title, "Price per Unit," to change the range, or click on the current value, "$2.75," to get a drop down list of values to select a new one.
Compare to
Comparisons can be made to any other scenario, start period, case dimension or case parameter value (or any combination). Each comparison type will be drawn with a different line style (dotted, dashed, etc). Comparison lines can be hidden or shown by clicking on the line in the comparison legend box. The comparison can be changed by clicking on the comparison title in the comparison legend box.
Chart Variations
A chart variation is a temporary change to some chart attribute. If a chart variation is shown the "previous variation icon" will appear in the upper left corner and a short description of the chart variant will be shown below the chart title. Any number of variations can be combined. Not all variations will be possible in all charts. Variations can include:
- Model Scenario
- Start period (can be an expression using case parameters from the Model Scenario)
- End period (can be an expression using case parameters from the Model Scenario)
- Type of chart, including line, spline, bars, columns, area, stacked variations
- Series: what to display in the series (typically data is displayed)
- X Axis: what to display along the X Axis (typically time is displayed)
- Slides: what to display alone the slide dimensions (typically scenarios, or case parameter variations)
- Data: click + to add data to be displayed or click existing data and select "Change Data" to modify. The order of the data series shown in the legend can be arranged by clicking to move left or right.
- Data Properties: Line Item's can be formatted with various properties. See "Line Item Formatting" below.
- Data Organization: Numerous options that specify how the data is organized. Named Organizational Styles can be used or specified explicitly. New charts will default to "None" which orders data based on the left to right order of items specified in the Data section.
- Comparisons: compare data with other scenarios or variations
In addition to the above variations, drill down is also considered a variation, but drill down is selected by clicking on one of the data points in the chart.
Line Item Formatting
Individual line items (or sets of line items) can be formatted via the following properties:
- The "Color" can be selected (replacing the default series assigned color).
- The "Type" of chart can be changed. For example, some line items can be shown with lines, and others as columns.
- The "Dash Style" can be changed (e.g. solid, dash, dash-dot etc).
- The "Line Width" can be changed.
- The "Marker Radius" can be changed.
- "Retitle" allows a custom name to be shown in the Chart Legend for a data series in the chart.
To specify line item formatting click on the Chart Menu and select "Variations". In the Data Properties section, click + to add formatting property columns as described above (Color, Type, Dash Style, Line Width, Marker Radius, Retitle) to the table that can be assigned to Line Items, Groups or Line Items Sets in the table. These properties can be modified as well.
Drill Down and Data Tables
To drill down into a group of data, select the data point of interest and click to see the data value as well as an option to drill down (if drill down is possible). By clicking on the drill down button, the chart is redrawn as a chart variation. Click on the "previous variation icon" to go back. The plus button can be clicked to show the full data table with the row and column highlighted that the chosen data point belongs to. Once displayed the table columns or rows can be sorted according to value or title. The table can also be exported as an HTML table.
Chart Options submenu
The chart options submenu provides options for changing chart features and appearance without changing the data content of the chart. These features can include
- Chart theme: this selects the color scheme and appearance of the chart.
- Show Data Point Values: (select one of: only on mouse click, on mouse over, display on chart)
- Show Stack Totals: (only for stack charts)
- Show Compare Box (can be used to hide the comparison legend box)
- X Axis scaling (select how the X Axis labels should be displayed)
- Y Axis scaling (select how the Y Axis labels should be scaled)
- Play Speed (select how slow or fast slides should be shown during play or comparison of slides)