Bubble Charts
A bubble chart differs from other charts in two important ways.
- The data for a bubble chart is restricted to FOs (Financial objects) of a particular type. Each FO is displayed as a bubble.
- The X value, Y value, and Size of the bubble is determined by selecting FO parameters of the FO type.
Example: Risk Reward Bubble Chart
Consider an FO type, representing a project (or product) with the following parameters:
- Probability of technical success (mapped to the Y Axis)
- Cost cash flow
- Revenue cash flow
- Net present value (mapped to the X Axis, discount rate based on a slide dimension)
- Resources needed (mapped to bubble size)
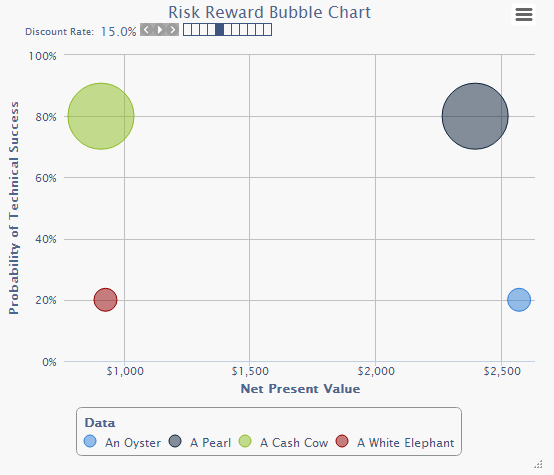
Charts are designed by specifying content, called the Chart Variation, and by specifying the look and feel, called the Chart Theme. Chart Themes are created in a separate object and can be used with any chart. Both chart variation and options are initially specified in the chart object, but viewers of the chart can make temporary changes to the initial settings.
The chart is displayed in the panel. Clicking on the Chart menu icon will display sub-menus changing the chart variation and chart options. The chart can be resized and if slide dimensions are present, the initial chart slide can be selected.
Initial Chart Variation
The initial chart variation specifies the following information:
- Start period
- End period
- Model Scenario
- FO Type (what type of FOs can be displayed as bubbles in this chart)
- X Axis: what to display along the X Axis (any FO parameter of the FO type selected above)
- Y Axis: what to display along the Y Axis (any FO parameter of the FO type selected above)
- Bubble size: what to display as the bubble size (any FO parameter of the FO type selected above)
- Slides: what to display alone the slide dimensions (typically scenarios, or case parameter variations)
- Data: change what data is displayed
Initial Chart Options and Size
The chart options submenu provides options for changing chart features and appearance without changing the data content of the chart. These features include
- Chart theme: this selects the color scheme and appearance of the chart.
- Enable tooltips on mouse over of data points in the chart (clicking on a datapoint will always show the data value)
- Play Speed (select how slow or fast slides should be shown during play or comparison of slides)
Other Options
Using the Add feature, more options can be displayed, including the following:
- Block data variations: if selected, the chart user cannot vary the data
- Block scenario variations
- Block X, Y and Bubble size variations