Dashboards
Dashboards are purpose-built in a modern, fluid, and easy to use interface to help you analyze outcomes. Dashboards are a centralized location to aggregating your modeling objects such as reports, charts, and input managers. In Dashboards you can conduct scenario analysis easier than ever.
Creating a Dashboard
A user with write permissions can create a dashboard. Dashboards can be created in the following ways.
Power User
A user with Power access to a model who is in Power User mode, can create a dashboard by Expanding the Dashboards section in the navigation tree panel on the left side, right-clicking and selecting "Add Dartboard". You can give the dashboard a title and click the "Go to Dashboard" button for Dashboard mode to visit the new dashboard to add modeling objects to it.
Dashboard Mode
When in Dashboard Mode, Click the "Create Dashboard" button on right side of the sub-navigation bar. A popup will appear where you can give the Dashboard a title. Click "Create Dashboard" when ready.
Dashboard Selection
Depending on user type and access to any available dashboards, when a model is opened a Power User will start in Power User mode and selects "Dashboards" from the View drop-down menu on the top Nav Bar. Non-power users with access to any available dashboards will start in Dashboard mode in any Dashboard that is favorited and was last used. See Dashboard Favorites below for more details.
Dashboard Favorites
To favorite a Dashboard click the star to the left of the name in the drop-down list or when the star to the left of name of the Dashboard that is currently loaded.
Working with a Dashboard
Starting with an example Dashboard workspace, this topic describes how to work with a Dashboard including how to create tiles and work with them.
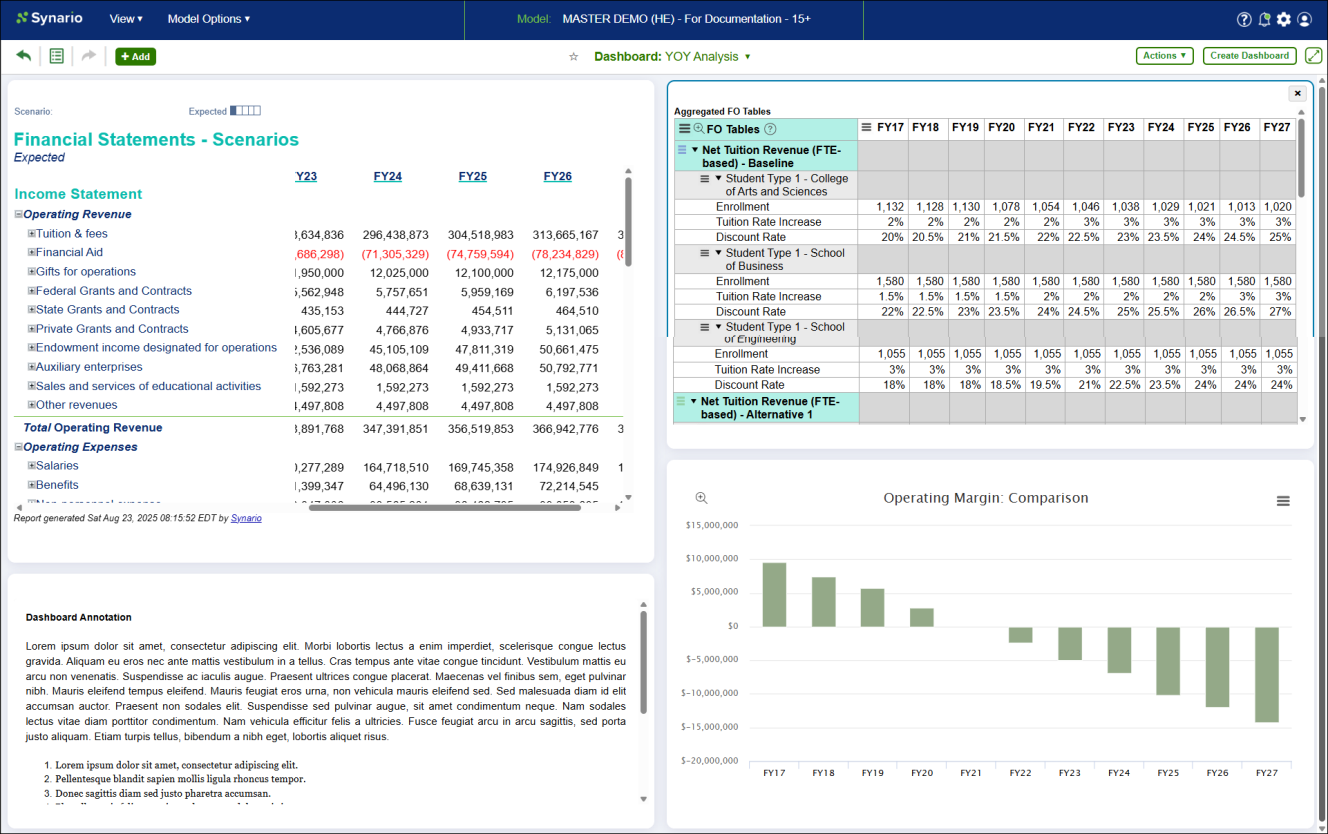
Dashboards Sub-Navigation Menu Bar
The following features are available from the Dashboards Sub-Navigation Menu Bar from left-to-right:
Undo: Click to quickly undo the last consecutive change. Note: if another user sharing the model and dashboard makes the last change, your last change cannot be undone.
Change Log: A list of all changes. Undo or Redo buttons are available on consecutive changes (changes that are uninterrupted by another user's changes).
Redo: Click to quickly redo the last undone change as long as it wasn't interrupted by a new change by another user sharing the model and dashboard.
+ Add: Click to Add Model Objects to the Dashboard. See the Add Object topic below for details
Dashboard Name: The name of the selected Dashboard. Click to see a drop-down list of all available Dashboards to select organized by "Favorites" and "Other (non-favorite) Dashboards"
Action button: The following selections are available -
-
Copy: Make a copy of the Dashboard
-
Retitle: Change the title of the Dashboard
-
Add Text Panel: Click to create a Text Panel. Text Panels can also be created by Power Users in Power User Mode.
-
Delete: Delete the Dashboard from the model.
Create Dashboard: Click to create a new Dashboard and give it a title. Dashboards can also be created by Power Users in Power User Mode.
Adding Objects to a Dashboard
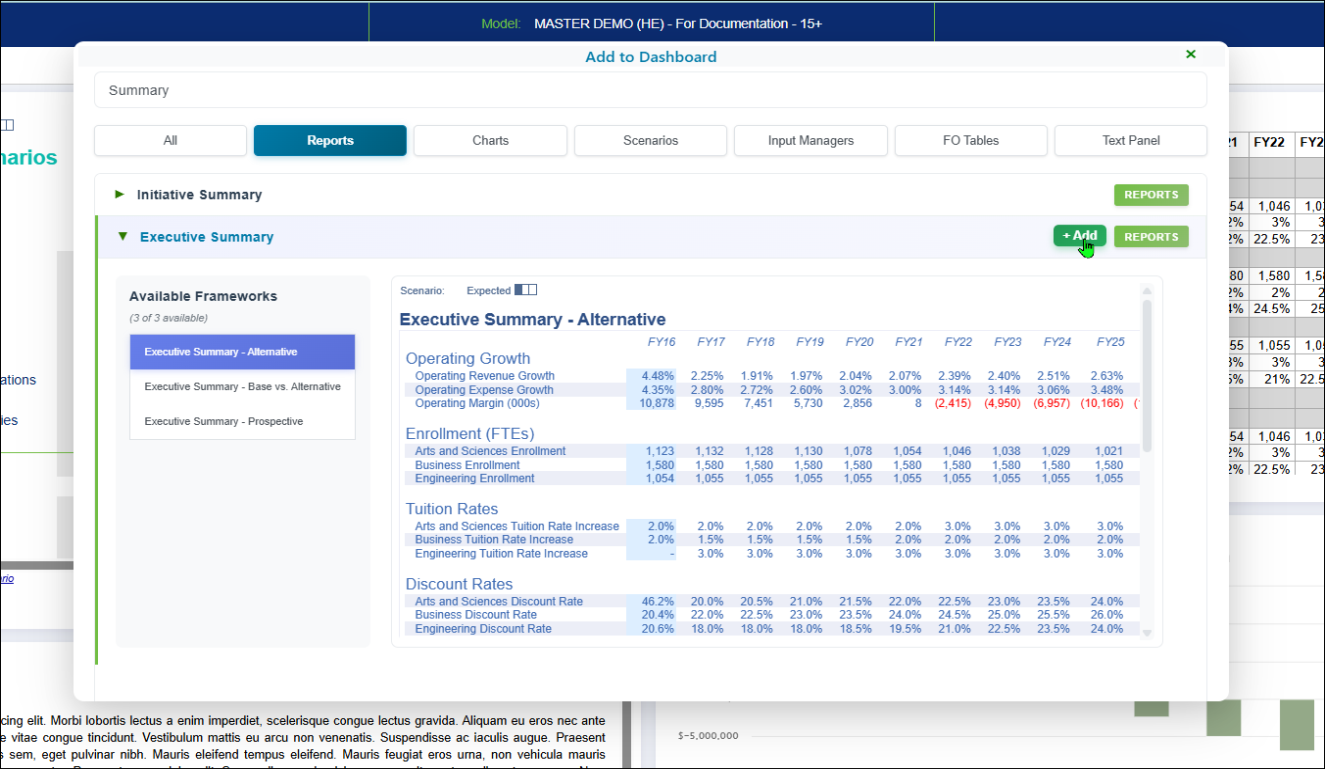
Click the + Add button on the Sub-Nav bar to add objects to your Dashboard. The Add to Dashboard Pop-up will appear. Optionally use the search bar to filter matching object names. As you type, the list of available objects to add will be filtered that match. You can directly select or search to filter objects starting with any of the available object categories: All, Reports, Charts, Scenarios, Input Managers, FO Tables or Text Panels.
Example Add Object Pop-up
The following example shows the Add to Dashboard pop-up using search to filter the available reports. The Executive Summary report object preview window was expanded to show the report preview and the one of the available frameworks was selected. Once the desired object is confirmed, click +Add to add to the Dashboard. Newly added objects appear on left-side of Dashboards under any existing tiles. Those new tiles and any existing tiles can be fluidly dragged and dropped around the workspace to rearrange them.
Working with Dashboard Tiles
Newly added objects are found on left side of the dashboard under any existing tiles. All tiles can be easily dragged and dropped to reposition them. Easily resize tiles by right-clicking on the tile size handle at the bottom right-side of the tile. Drag and release the tile size handle when you have found the desired size and shape. Remove tiles from the workspace by clicking the "x" in the upper right corner of a tile. Removing a tile from the Dashboard workspace does not delete the object from the model. Objects in a model can only be deleted by Power Users with edit access in Power User Mode.
Interacting with Dashboard Objects
Depending on the type of object in a Dashboard Tile and access permissions, a user can click on the various objects on a dashboard and use the features available in those objects. For example, on a report, click on a cell to select from various available options such as running Explain or Adding to the Scratchpad. Click on an FO Table or Input Manager cell to edit that cell, Use the 3-Bar menu in a chart to edit the Options or Variations of the Chart, Click a Scenario to change the available conditions of the Scenario which can affect the display of the various objects that currently populate the Dashboard.
Text Tiles
Text tiles are used in any way that you find useful such as including general notes or instructions about how you want the Dashboard used or to include information about any of the Dashboard tiles populated on the workspace. Text Tiles can be created by Power Users in Power User Mode from the Dashboards Category and Sub-group or they can be created by users who have edit access to the Dashboard via the "Create Dashboard" button at the upper right of the sub-nav menu. Newly added Text Tile will appear on the left-size of the Dashboard workspace under any existing tiles. Click the tile to fluidly drag and drop to re-arrange it on your workspace and click and drag the tile handle on the bottom right of the tile to adjust the size of the tile.
Power Text Panel and Dashboards Text Tile Synchronization: Text Panels created in Power User are available to be added to a Dashboard workspace as Dashboard Tiles by choosing the Text Tile from the Add to Dashboard pop-up. Dashboards created inside dashboards will be listed in the Dashboard group in the Navigation Tree under the Dashboard group for Power Users to access. Updates to the contents or title will be synchronized across both modes.
Adding or Editing Text Tile Content
Click inside a text tile to go to edit mode. When editing a text tile, you can modify the tile and use the text tile editor to add or modify content. The editor has many common editor features available such as: Heading Size, Font Type and Size, Text Color, Background Color, Bold, Italic, Underline, Numbered or Bulleted List, Table Creation, etc. Once all changes are made, Click Save or Cancel.